Views are one way that software designers organize information so that you can get at it in logical ways. Because of the complexity of information in a typical Project plan, many views are available to examine it. If you think of your average word-processed document as being about as complex as a cookie, your average Project plan is a five-tier wedding cake adorned with intricate flowers and garlands in delicate gobs of sugary icing.
In a typical Project plan, you have information about the following:
- Resources. The resource name, type of resource, rate per hour, overtime rate, assignments, department, and cost per use, and more.
- Tasks. The task name, duration, start date, finish date, assigned resources, costs, constraints, dependencies, and so on.
- Project timing and progress. Several types of calendars, project start and finish dates, percent of tasks completed, resource hours spent, baseline information, and critical path information, and more.
- Financial information. Earned value, time and cost variance, projected costs for uncompleted work, and so on.
You can see that finding out how to use the many Project views to enter, edit, look at, and analyze Project data is important. Don't worry that you'll be overwhelmed: After a while, using all those views is . . . well, a piece of cake.
Home base: Gantt Chart view
Gantt Chart view is like a favorite room in your house, the place most people gravitate to. It's the place that appears first when you open a new project. This view, shown in Figure 1, is a combination of spreadsheet data and a graphical representation of tasks; it offers a wealth of information in one place.
>

>
Figure 1: Gantt Chart view can display any combination of columns of data that you want.
Gantt Chart view has two major sections. The area to the left is called the sheet, which is a spreadsheet-like interface with columns of information. To the right of this view is the chart. The chart uses bars, symbols, and lines to represent each task in your project and the dependency relationships between them.
At the top of the chart area is the timescale. This tool is used as a scale against which you can interpret the timing of the taskbars. To see your plan in greater or lesser timing detail, you can modify the time units used in the timescale. For example, you can look at your tasks in detail over days or in a broader overview in months.
Go with the flow: Network Diagram view
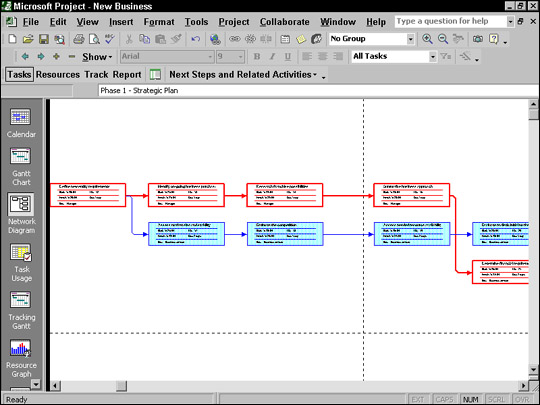
Another view that you're likely to use often is the Network Diagram view, which is shown in Figure 2. The organization of information represents the workflow in your project, with a series of task boxes. The boxes include dependency lines running among them to reflect their timing relationships. You read this view from left to right, with the earlier tasks on the left flowing into later tasks and subtasks to the right.
>

>
Figure 2: Network Diagram view puts important task information in task boxes.
Traditionally called a PERT chart, this method of diagramming workflow was developed by the Navy in the 1950s for use in building Polaris submarines.
Network Diagram view has no timescale because the view is used not to see specific timing but to see the general order of tasks in a plan. However, each task box does include specific timing information about each task, such as the start, finish, and duration. You can customize the information in the task boxes.
Call up Calendar view
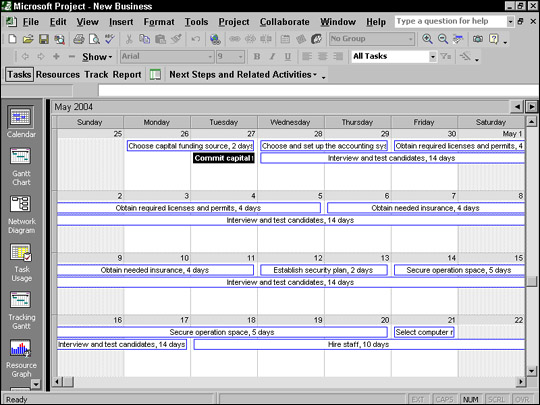
Who can think of time without conjuring up a calendar? This familiar view of time is one of the many views offered in Project. The Calendar view, shown in Figure 3, shows tasks as boxes that fall across the blocks that represent days in a calendar.
>

>
Figure 3: The familiar calendar interface shows you how one task can straddle several days or even weeks.
You can modify Calendar view to display from one to six weeks (or more using a Custom setting in the Zoom dialog box) on the screen at a time. Calendar view also includes a timescale that you can modify to show a seven-day or five-day week and shading to indicate working and nonworking days based on a selected base or resource calendar.
Dozens of views are built into Project. You'll encounter many more as you work through specific elements of Project.
>
dummies
Source:http://www.dummies.com/how-to/content/viewing-projects-in-microsoft-project-2002.html
No comments:
Post a Comment